
The RFNBO greenhouse gas methodology under EU Regulation 2023/1185: the E formula, the 94 gCO2e/MJ comparator, and the 28.2 gCO2e/MJ pass mark, explained.
Introduction
The carbon footprint of green hydrogen is not a matter of opinion. EU Regulation 2023/1185 sets one method, one formula and one pass mark, and every RFNBO project is measured against them. This article explains how the calculation works: the formula, the fossil comparator, the 28.2 gCO2e/MJ threshold, and the choices that move the number up or down. If you want to know whether your hydrogen or ammonia will qualify, this is the calculation that decides it.
The formula
The lifecycle carbon intensity of the fuel, written as E, is calculated by adding up the emissions from each stage of its life and subtracting any carbon that is captured and stored.
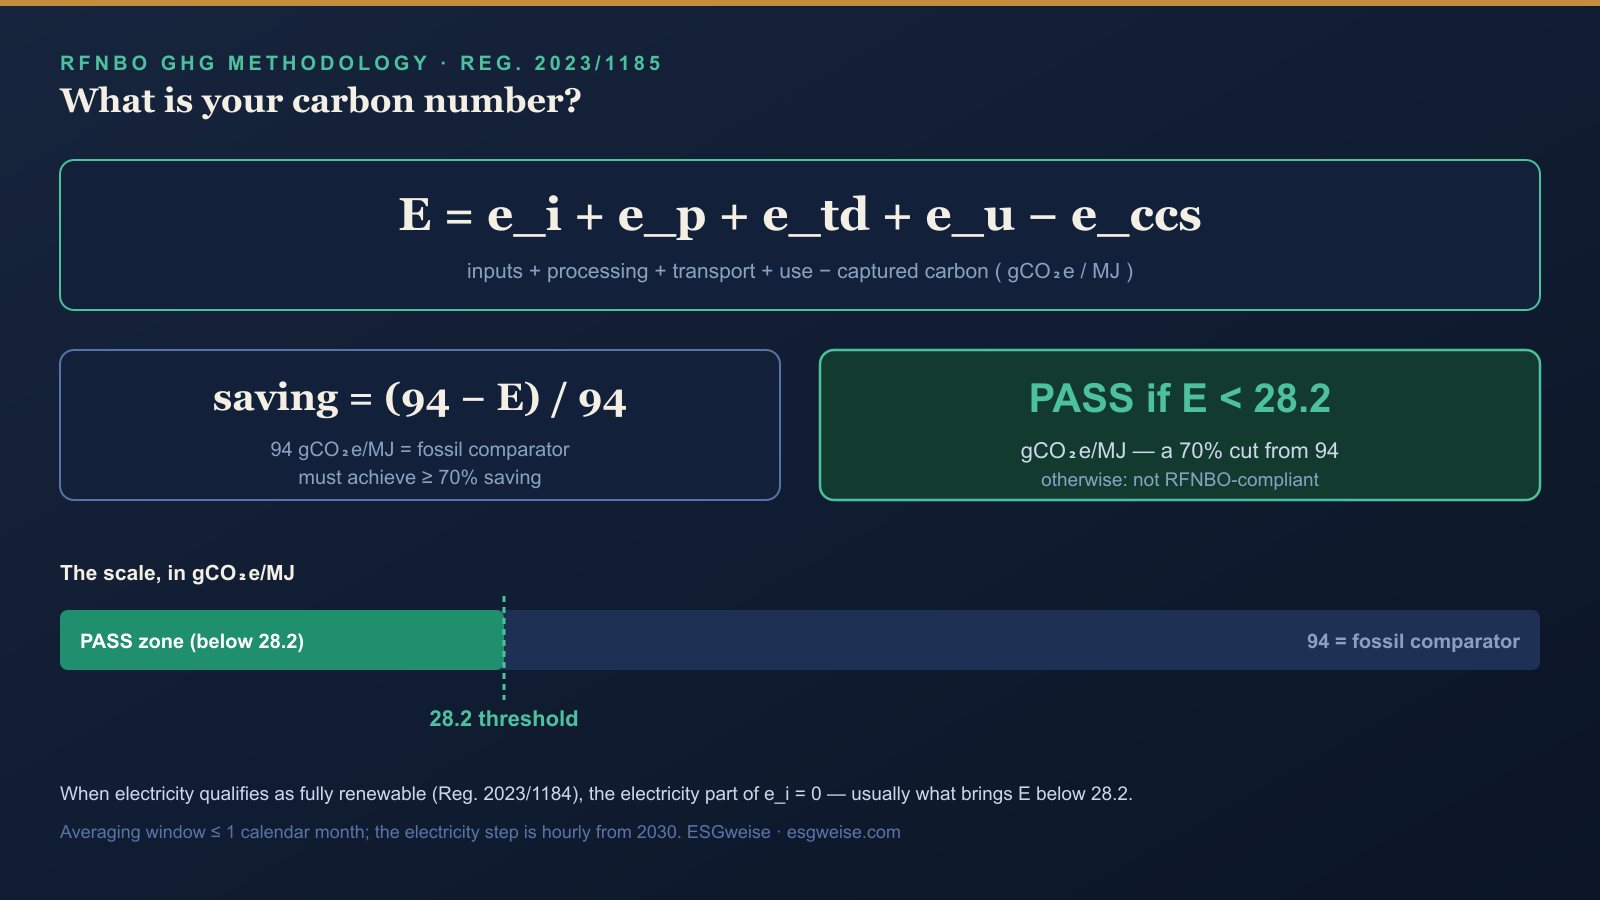
E = e_i + e_p + e_td + e_u − e_ccs
| Term | What it covers |
|---|---|
| e_i | Emissions from inputs, including electricity and raw materials |
| e_p | Emissions from processing, such as electrolysis and synthesis |
| e_td | Emissions from transport and distribution |
| e_u | Emissions from use of the fuel |
| e_ccs | Carbon captured and stored, which is subtracted |
The result, E, is expressed in grams of CO2-equivalent per megajoule.
The pass mark
The saving is measured against a fossil fuel comparator of 94 gCO2e/MJ:
saving = (94 − E) / 94
The fuel qualifies as an RFNBO if the saving is at least 70%. Seventy percent of 94 is 65.8, so the carbon intensity E must be below 28.2 gCO2e/MJ. If E is at or above 28.2, the fuel does not qualify, whatever else is true about the project.
Where the emissions come from
For green hydrogen and ammonia, most of the residual carbon number, once renewable electricity is scored at zero, comes from a handful of sources. Raw materials and consumables contribute to inputs. Any non-renewable energy in processing contributes to processing. Transport and shipping contribute to transport and distribution, which matters a great deal for ammonia exported by sea. The boundary can run all the way to the point of use, which for an export project means to the EU port, including shipping.
By-products and allocation
Ammonia synthesis and electrolysis produce more than the main product, and how by-products are treated affects the number. If a by-product such as the oxygen from electrolysis is valorised rather than vented, economic allocation can shift a share of the emissions off the hydrogen or ammonia. If it is not valorised, all the emissions stay with the main product. One point is easy to get wrong: the nitrogen fed into ammonia synthesis is a wanted input, not a by-product, so it is not allocated against.
The RFNBO carbon number is built, term by term, from real project data. The threshold does not move, so the project has to.
The averaging window
The method also sets how the number is averaged over time. The averaging window is at most one calendar month. From 2030, the electricity step moves to hourly resolution, in line with the temporal correlation rules. A project that relies on monthly averaging today should model what its number looks like under hourly matching, so the shift does not come as a surprise.
How ESGweise helps
Building the E calculation correctly, term by term, is core to what ESGweise does. We construct the greenhouse gas and lifecycle model to the 2023/1185 method, set the system boundary to the point of use, handle allocation defensibly, and stress-test the result against the 28.2 threshold before an auditor ever sees it. This draws directly on our greenhouse gas accounting work and the lifecycle assessment and ISO 14064 quantification methods that underpin it. See the full scheme in the CertifHy pillar guide.
Conclusion
The RFNBO carbon footprint is calculated with one formula, E = e_i + e_p + e_td + e_u − e_ccs, and judged against one number, 28.2 gCO2e/MJ. The most powerful lever is the electricity qualification, which can score the largest input at zero. Everything else, from allocation to shipping, then decides whether the project clears the threshold with room to spare or falls short. Building the calculation carefully and early is how a producer knows, before committing capital, whether the project will qualify.
Related guides
Frequently asked questions
How do you calculate the carbon footprint of green hydrogen?
Under EU Regulation 2023/1185, the lifecycle carbon intensity is calculated as E = e_i + e_p + e_td + e_u minus e_ccs. These terms represent inputs, processing, transport and distribution, use, and any carbon that is captured and subtracted. The result, E, is the carbon intensity in grams of CO2-equivalent per megajoule. It is then compared to a fossil benchmark of 94 gCO2e/MJ to determine the saving.
What is the 28.2 gCO2e/MJ threshold?
An RFNBO must achieve at least a 70% greenhouse gas saving against the fossil comparator of 94 gCO2e/MJ. Seventy percent of 94 is 65.8, so the carbon intensity E must be below 28.2 gCO2e/MJ. This is the single pass mark that every RFNBO hydrogen and ammonia project is designed to meet.
Why is renewable electricity scored as zero in the calculation?
When the electricity qualifies as fully renewable under Regulation 2023/1184, the electricity component of the inputs term is scored at zero emissions. Because electricity is the largest input to electrolysis, this zero is usually what brings the total below 28.2 gCO2e/MJ. It is why the electricity qualification is the most important lever in the whole calculation.
How are by-products like oxygen treated in the calculation?
If a by-product such as the oxygen from electrolysis is valorised, meaning sold or used rather than vented, economic allocation can shift a share of the emissions away from the hydrogen or ammonia. If the by-product is not valorised, all the emissions stay with the main product. Nitrogen used in ammonia synthesis is a wanted input, not a by-product, so it is not allocated against.